
From Sensor to Dashboard — Where Data Gets Distorted and How That Changes Business Decisions
- Srihari Maddula
- Jan 4
- 5 min read

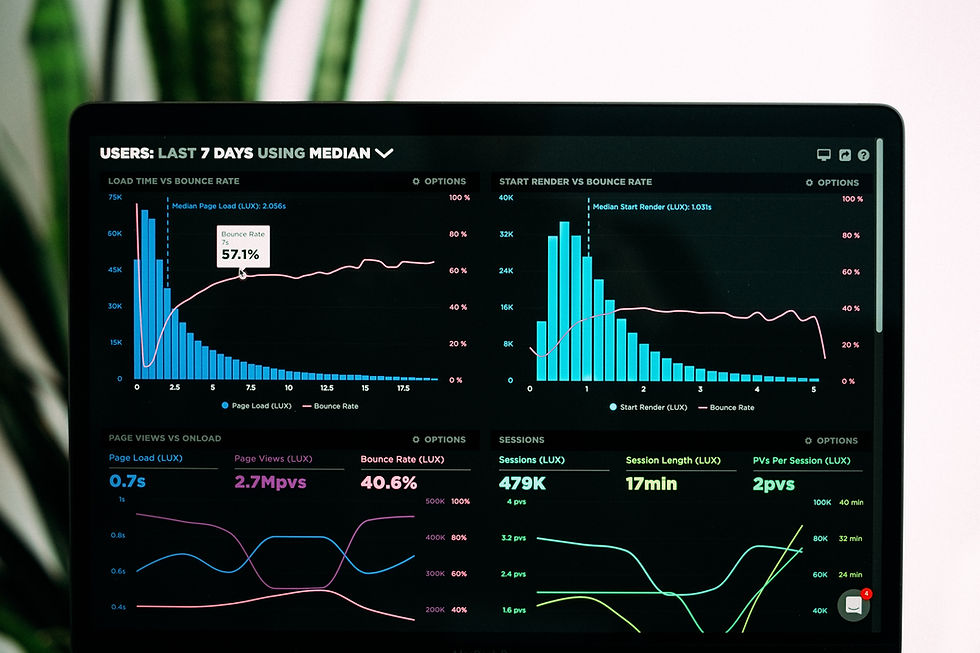
Most organizations assume that once data reaches a dashboard, it represents reality.
The charts look clean. The numbers trend in the expected direction. Alerts trigger when thresholds are crossed.
Yet, in many connected systems, what decision-makers see is not raw reality, but a version of reality that has already been shaped, filtered, delayed, or distorted by the time it reaches them. These distortions are rarely malicious or obvious. They emerge naturally from how systems are built, optimised, and scaled.
The danger is not that data is wrong. The danger is that data is confidently wrong
The Journey Data Takes Is Longer Than Most People Realize
A single data point travels through multiple layers before it becomes a business metric. Each layer makes trade-offs, often for good reasons, but every trade-off alters the shape of reality slightly.
By the time a dashboard displays a value, that value may have passed through sensor physics, firmware logic, protocol behaviour, network conditions, backend ingestion, data transformation, and visual aggregation. None of these layers are neutral.
Distortion is not a failure of one component. It is a system-level outcome.
Where Distortion Begins: At the Point of Measurement
The first distortion often occurs at the very moment data is measured.
Sensors do not measure concepts; they measure physical phenomena under specific conditions. Temperature sensors are influenced by placement, airflow, enclosure design, and thermal lag. Vibration sensors capture a mix of signal and noise depending on mounting and orientation. When firmware treats these readings as absolute truth without accounting for context, the distortion begins before data even leaves the device.
Sampling decisions further shape reality. A signal sampled once per minute tells a very different story from one sampled once per second. Spikes, transients, and short-lived anomalies can disappear entirely depending on how sampling is configured. From a business perspective, this can mean missing early warning signs while still believing the system is “monitoring”.
At this stage, distortion is subtle, but it is already influencing what the system believes is happening.
Firmware Logic: Where Interpretation Sneaks In
Firmware is rarely just a passive data forwarder. It filters, averages, thresholds, compresses, and sometimes discards information.
Averaging smooths noise but also removes extremes. In operational dashboards, this can make systems appear stable even when they are oscillating near failure limits.
Threshold-based logic simplifies alerts but introduces blind spots. Conditions just below thresholds may persist for long periods without triggering attention, even though they cause cumulative damage or inefficiency.
Error handling decisions determine whether missing data is flagged, retried, approximated, or silently ignored. Silent failures are particularly dangerous because they preserve the illusion of continuity.
These choices are usually made to conserve power, bandwidth, or processing time. The business impact, however, is that interpretation begins happening far earlier than most stakeholders realize.

Protocol Behavior: Distortion Through Optimization
Protocols exist to move data efficiently, not to preserve meaning perfectly.
Retries can change the apparent timing of events. Data that arrives late may still be displayed as if it were real-time, unless systems explicitly account for delay.
Buffering and batching improve efficiency but collapse temporal resolution. A burst of events may appear as a single averaged point on a dashboard.
Packet loss and reconnection logic can create gaps that are later filled in ways that look continuous but are not faithful to the original sequence of events.
From a dashboard perspective, the data still looks complete. From a forensic or decision-making perspective, the story has already been altered.
Backend Processing: Where Convenience Often Wins
Once data reaches the backend, it is usually transformed to fit storage models, analytics pipelines, or visual tools.
Normalization and unit conversion can introduce rounding and precision loss that is invisible at small scales but significant over long periods.
Time alignment across devices often assumes synchronization that does not truly exist, creating artificial correlations or masking real ones.
Data cleansing pipelines may remove outliers automatically, assuming they are errors, even when those outliers represent the most important events.
These transformations are rarely visible to end users. Dashboards present a polished narrative, not the raw journey the data took.

Dashboards: Where Distortion Becomes Decision-Making
Dashboards are where technical distortions turn into business actions.
Executives make calls based on trends. Operations teams respond to alerts. Finance teams evaluate performance metrics.
When distortion is present, decisions drift away from reality in small but compounding ways.
A system may appear stable while slowly degrading. An operation may look inefficient when it is actually constrained elsewhere. An intervention may be triggered too late or too early.
The dashboard does not lie. It simply tells a story shaped by upstream assumptions.
Why This Matters More as Businesses Scale
At small scale, distortions are tolerable. Teams rely on intuition, manual checks, and local knowledge to fill in gaps.
As scale increases, intuition disappears. Decisions rely more heavily on aggregated views. Small distortions, when multiplied across hundreds or thousands of devices,
become systemic bias.
At that point, organizations often experience symptoms such as declining trust in analytics, conflicting reports across teams, and a growing gap between what dashboards say and what field teams observe.
This is not a tooling problem. It is a system design problem.
Designing Systems That Preserve Meaning
Reducing distortion does not mean eliminating all transformation. That is neither practical nor necessary. It means being deliberate about where interpretation occurs and how uncertainty is preserved.
Devices should capture and transmit enough context to explain how a measurement was produced, not just the value itself.
Firmware should make interpretation explicit and traceable, rather than implicit and irreversible.
Protocols should preserve timing and sequence information even when optimizing for efficiency.
Backend systems should avoid collapsing uncertainty into false precision for the sake of cleaner visuals.
When systems are designed this way, dashboards become tools for insight rather than sources of illusion.

Distortion Is a Business Risk, Not a Technical Detail
Every distortion that goes unnoticed introduces risk.
Risk that decisions are made on incomplete information. Risk that interventions are mis-timed. Risk that confidence exceeds accuracy.
Over time, this risk expresses itself as missed opportunities, operational inefficiencies, and strategic misalignment.
The cost is rarely attributed to “data distortion”, but the impact is real and measurable.
The Question That Changes How Teams Build
Before adding more analytics, more dashboards, or more AI, there is a question worth asking:
If this data point drives a critical business decision, do we understand how it was shaped on its journey from sensor to screen?
If the answer is unclear, improving visualization will not improve decision quality.
At EurthTech, this is why we focus deeply on the full path data takes — not just how it is displayed. Because in connected systems, better decisions come not from more data, but from data that has retained its meaning.


Comments